- Booster Sprints
 Break your product’s bottlenecks fast with focused 2-4 week delivery sprints.
 - 100-Day MVPBuild and validate your MVP in 100 days with features that truly matter.
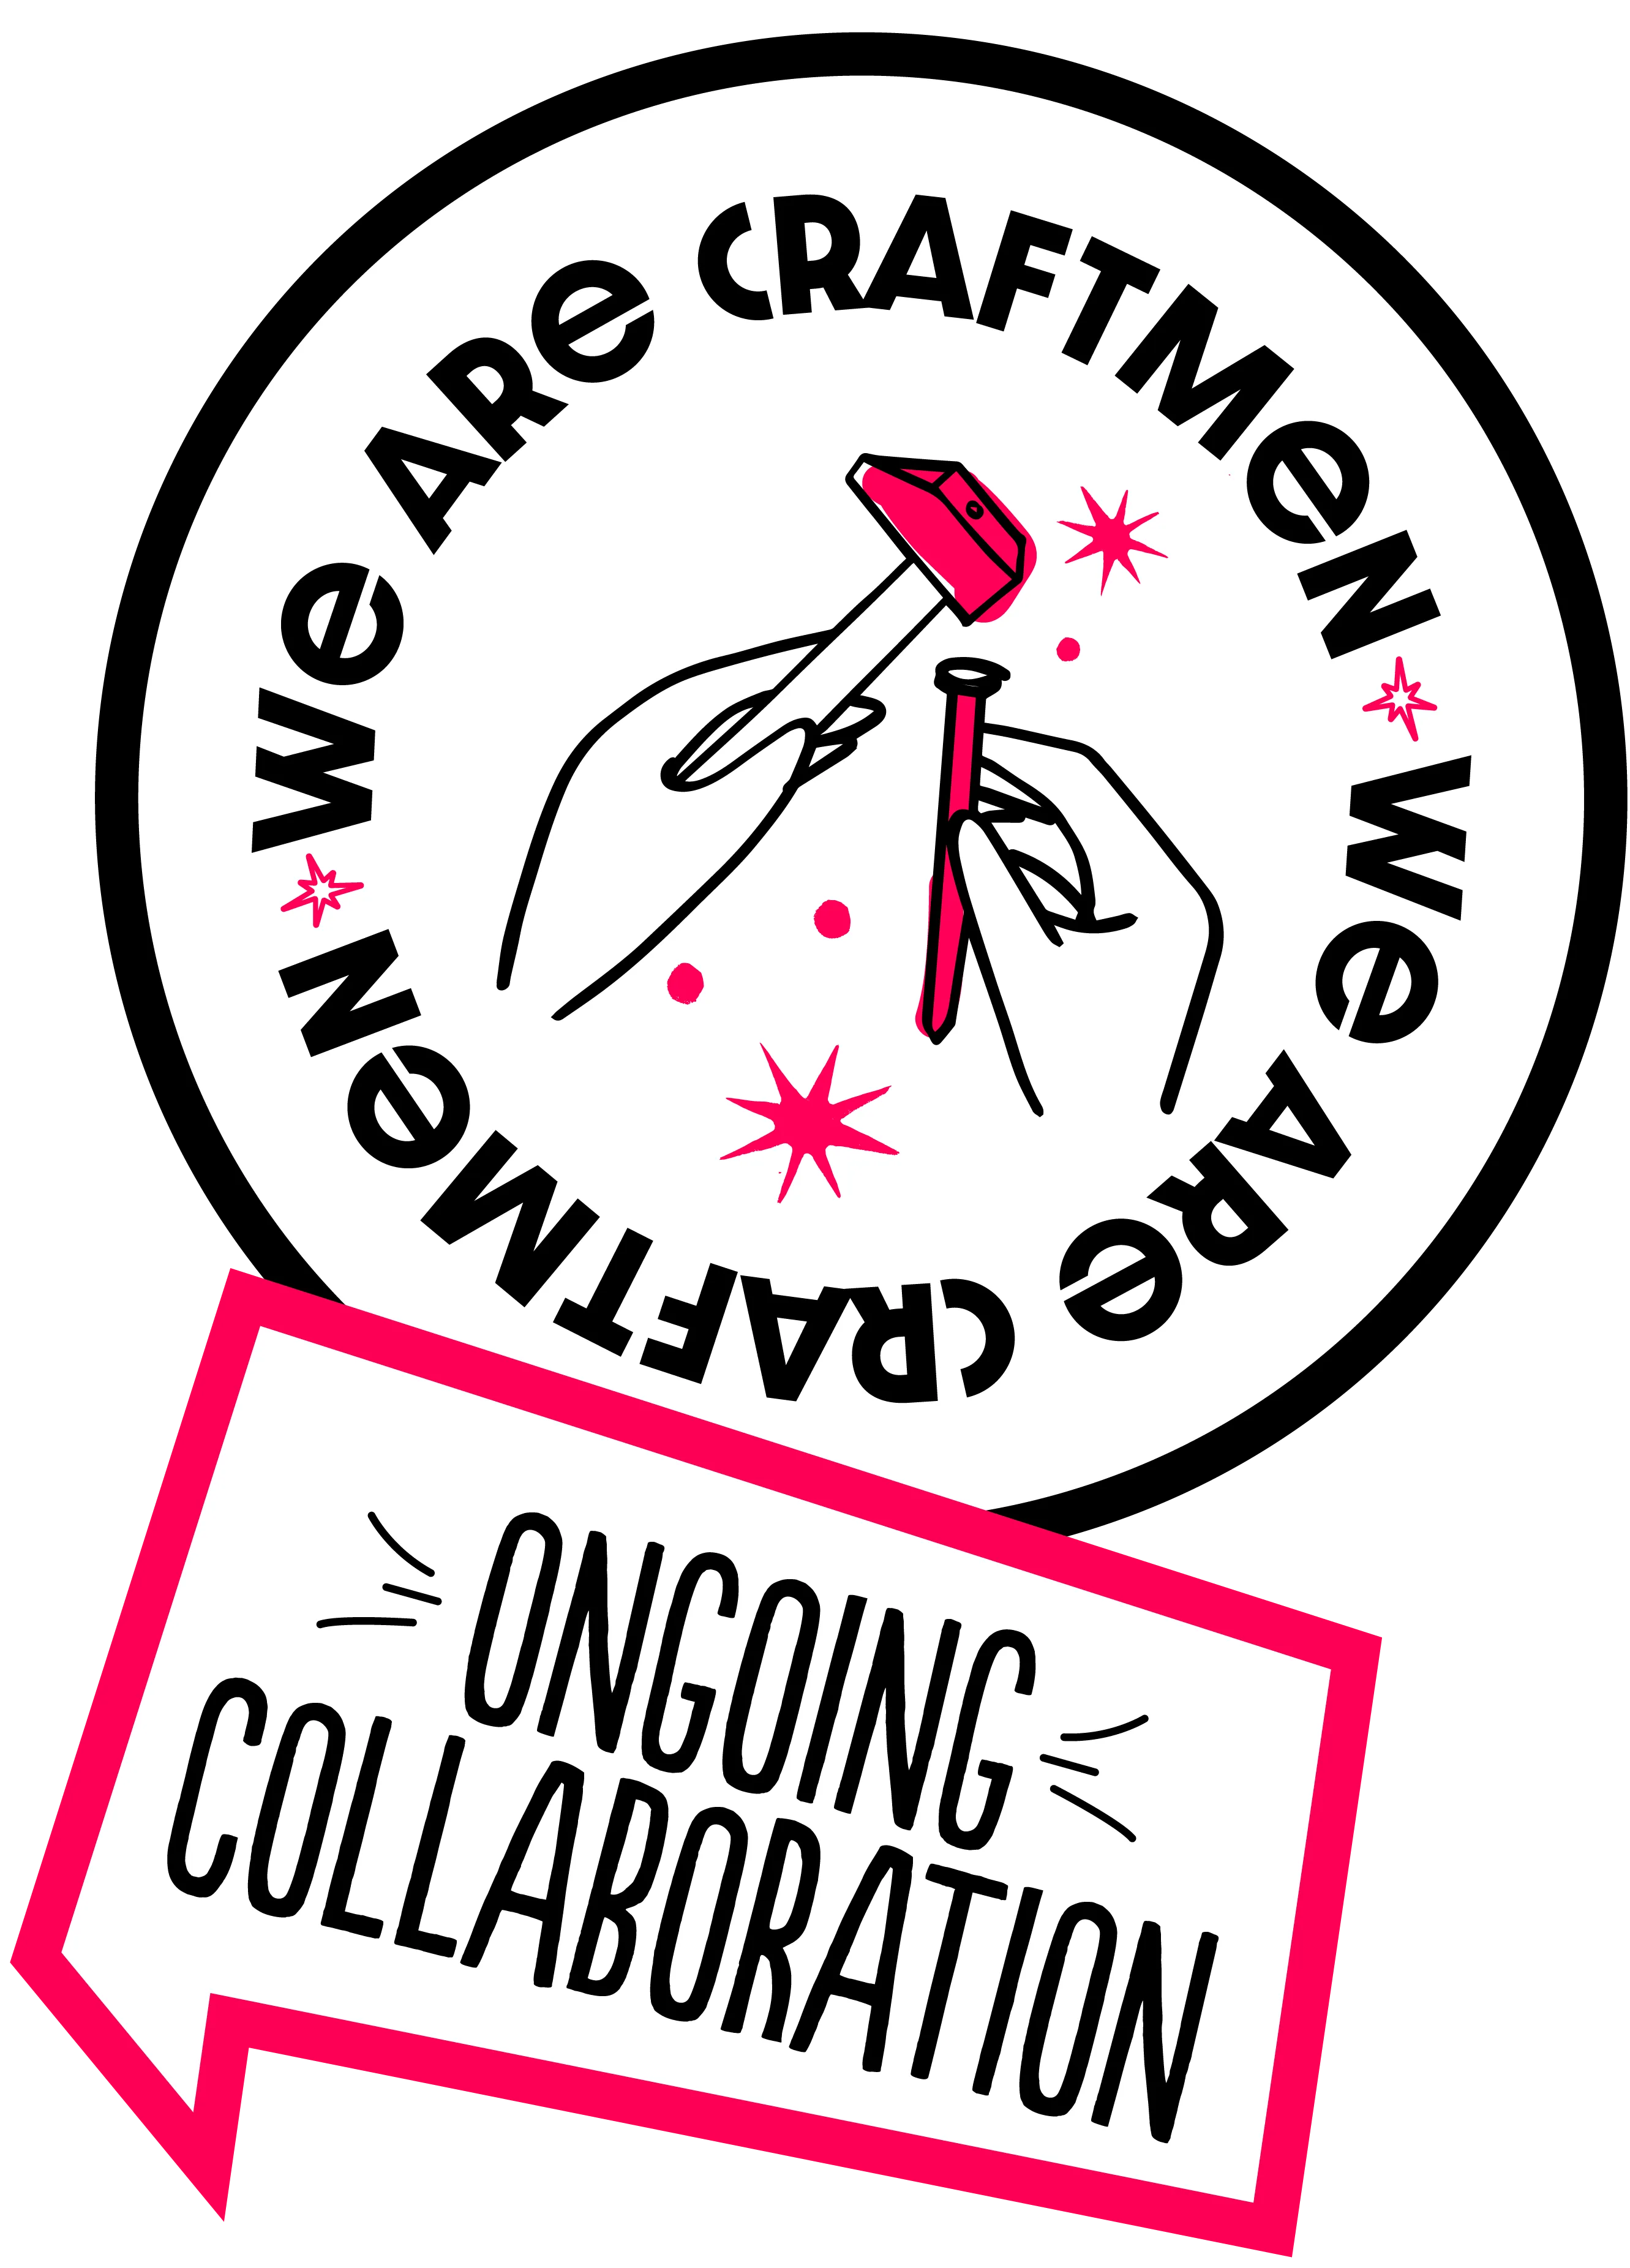
- Long-Term CollaborationBuild and scale confidently with a ready-made senior product team committed to your project.
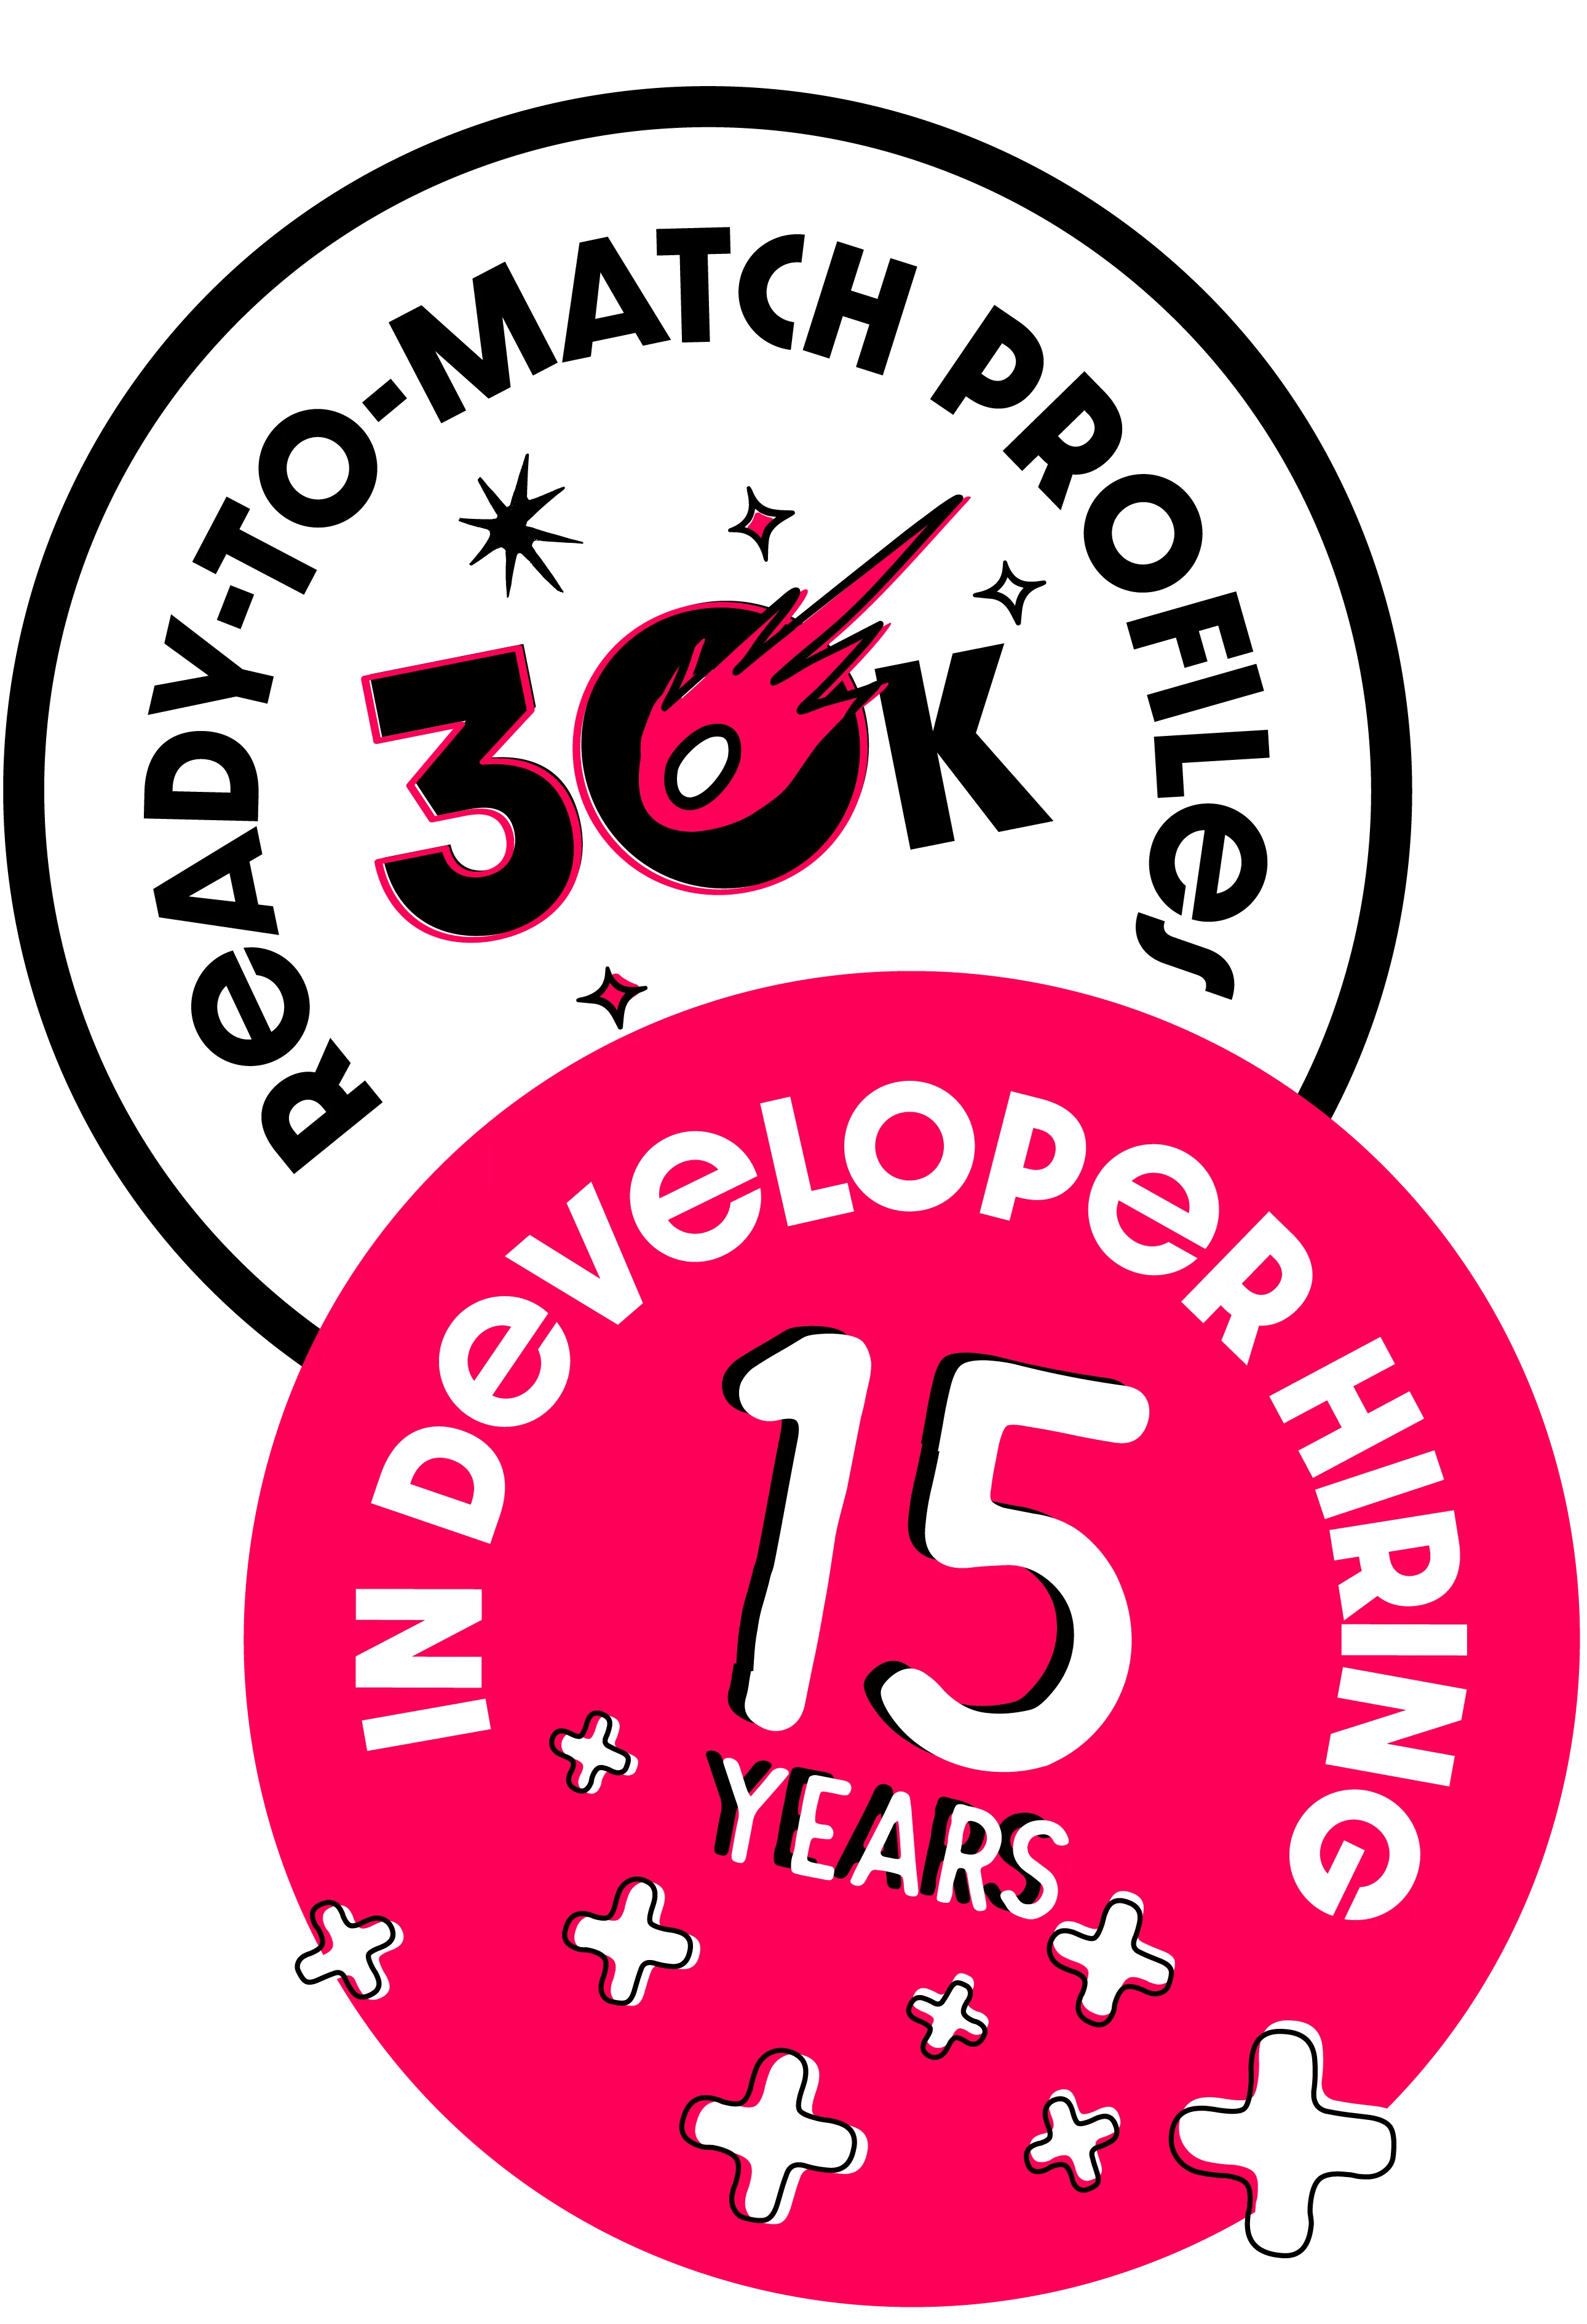
- Software Team AugmentationGet a network of 30K vetted software developers backed by 15+ years of talent and hiring expertise.
- Product Development PartnershipPower your venture studio with a dedicated development team with 200+ product builds.
Back


- AutomotiveKeep your automotive operations moving with fast and reliable digital tools.
- ConstructionBuild stronger, faster construction workflows with modern and scalable software products.
- Human ResourcesBring order and speed to your hiring and employee processes with smart digital tools.
- SaaSLaunch and scale SaaS products with technology built to scale without limits.
- GamingDeliver web operations that match the power and pace of every game you launch.
 Mercedes-Benz, GermanyA Tinder-like app redefining the Mercedes-Benz experienceBoosting Mercedes-Benz leasing applications by 15% with a Tinder-like matching app
 Volvo Cars, SwedenVolvo Cars’ official website management partnerManaging Volvo Cars’ web presence across 24 markets for over 8 years
 Gates (RAPRO), MENAOptimized digital experience for Gates’ MENA partnersDriving 42% growth in order volumes by Gates’ MENA partners after simplifying spare parts discovery
 Repairfix (BASF), GermanyAn online damage tracking system for a Germany-based startupBuilding the MVP that kickstarted Germany’s leading online damage tracking platform
 Heinrich Schmid, GermanyGiving a hand to the craftsmenWe developed the in-house application for Heinrich Schmid that is used by their own employees in...
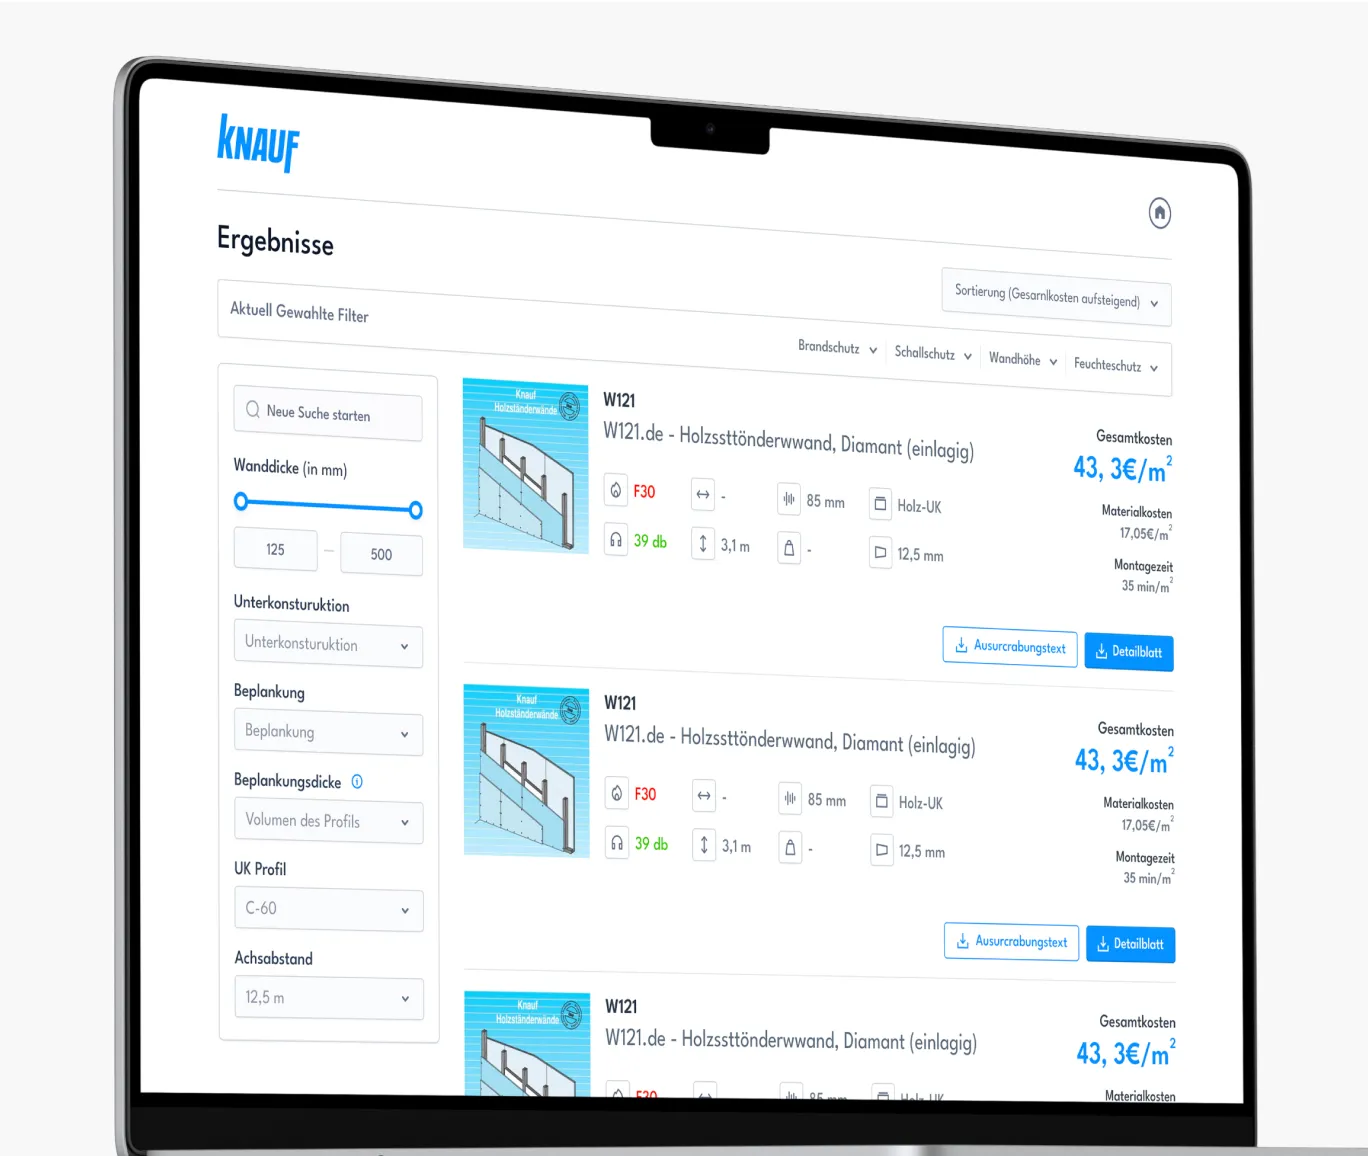 Knauf, GermanyKnauf’s smart system finder for tailored construction solutionsHelping Knauf deliver 4x faster access to 32K+ datasheets for construction professionals
 AkzoNobel, NetherlandsGlobal website management solution for AkzoNobelUnifying AkzoNobel’s global web presence across 18 countries in just 30 days
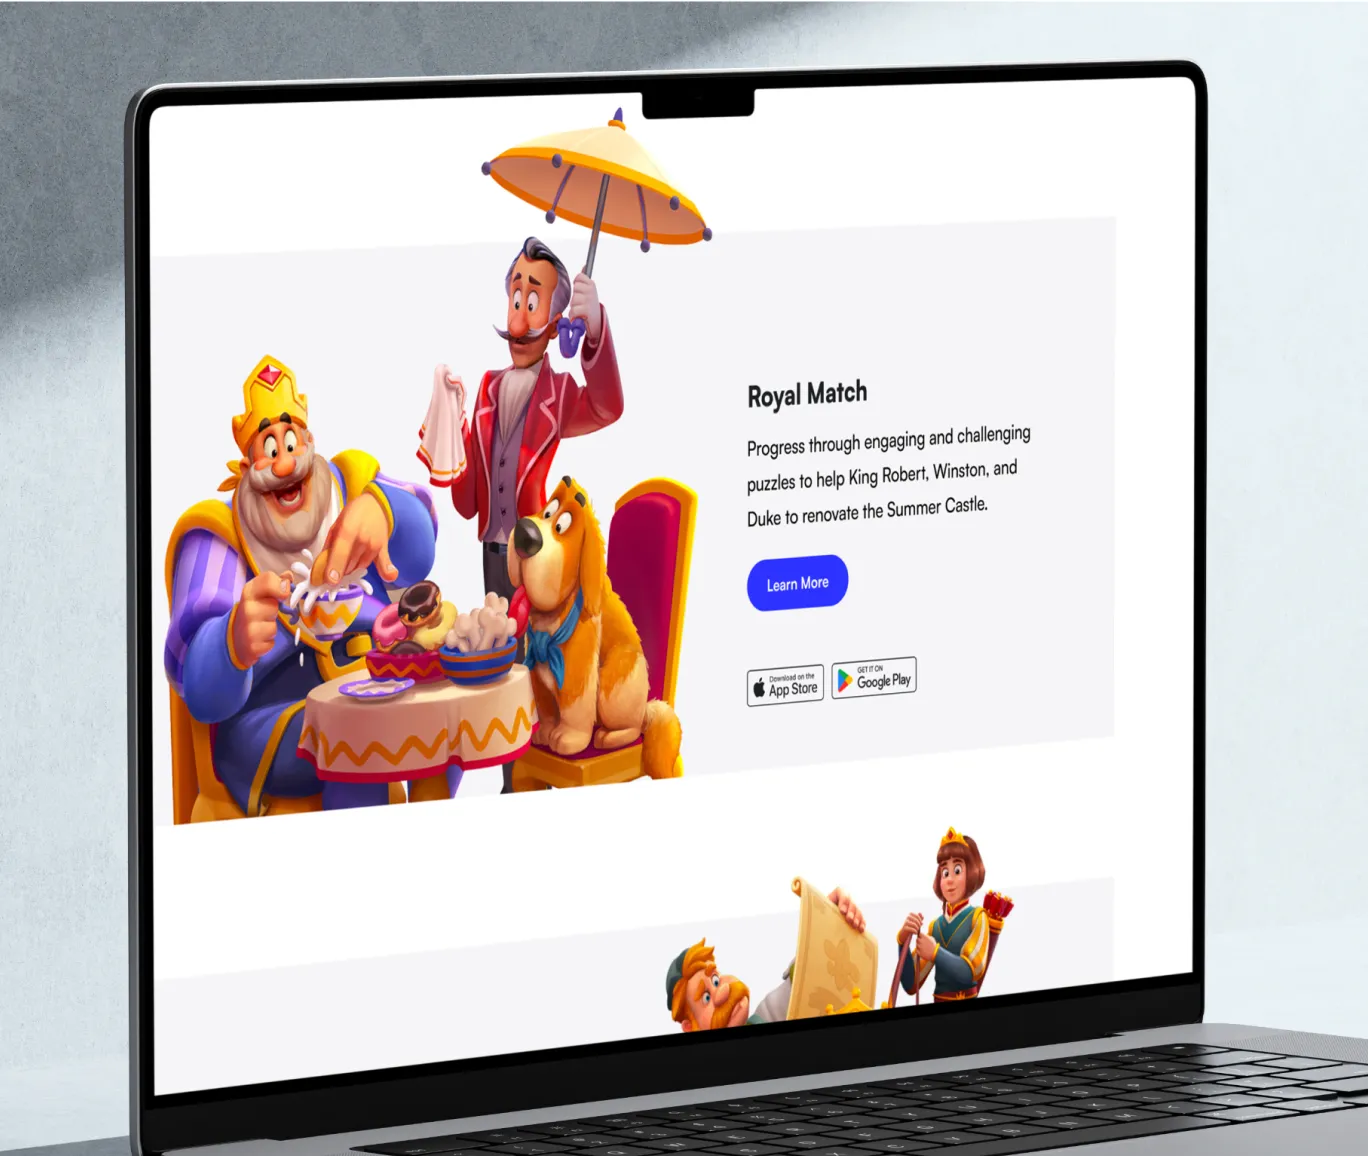 Dream GamesWebflow-driven platform for gaming startup with #1 App Store hitAchieving a 99% PageSpeed Score with a Webflow-driven platform
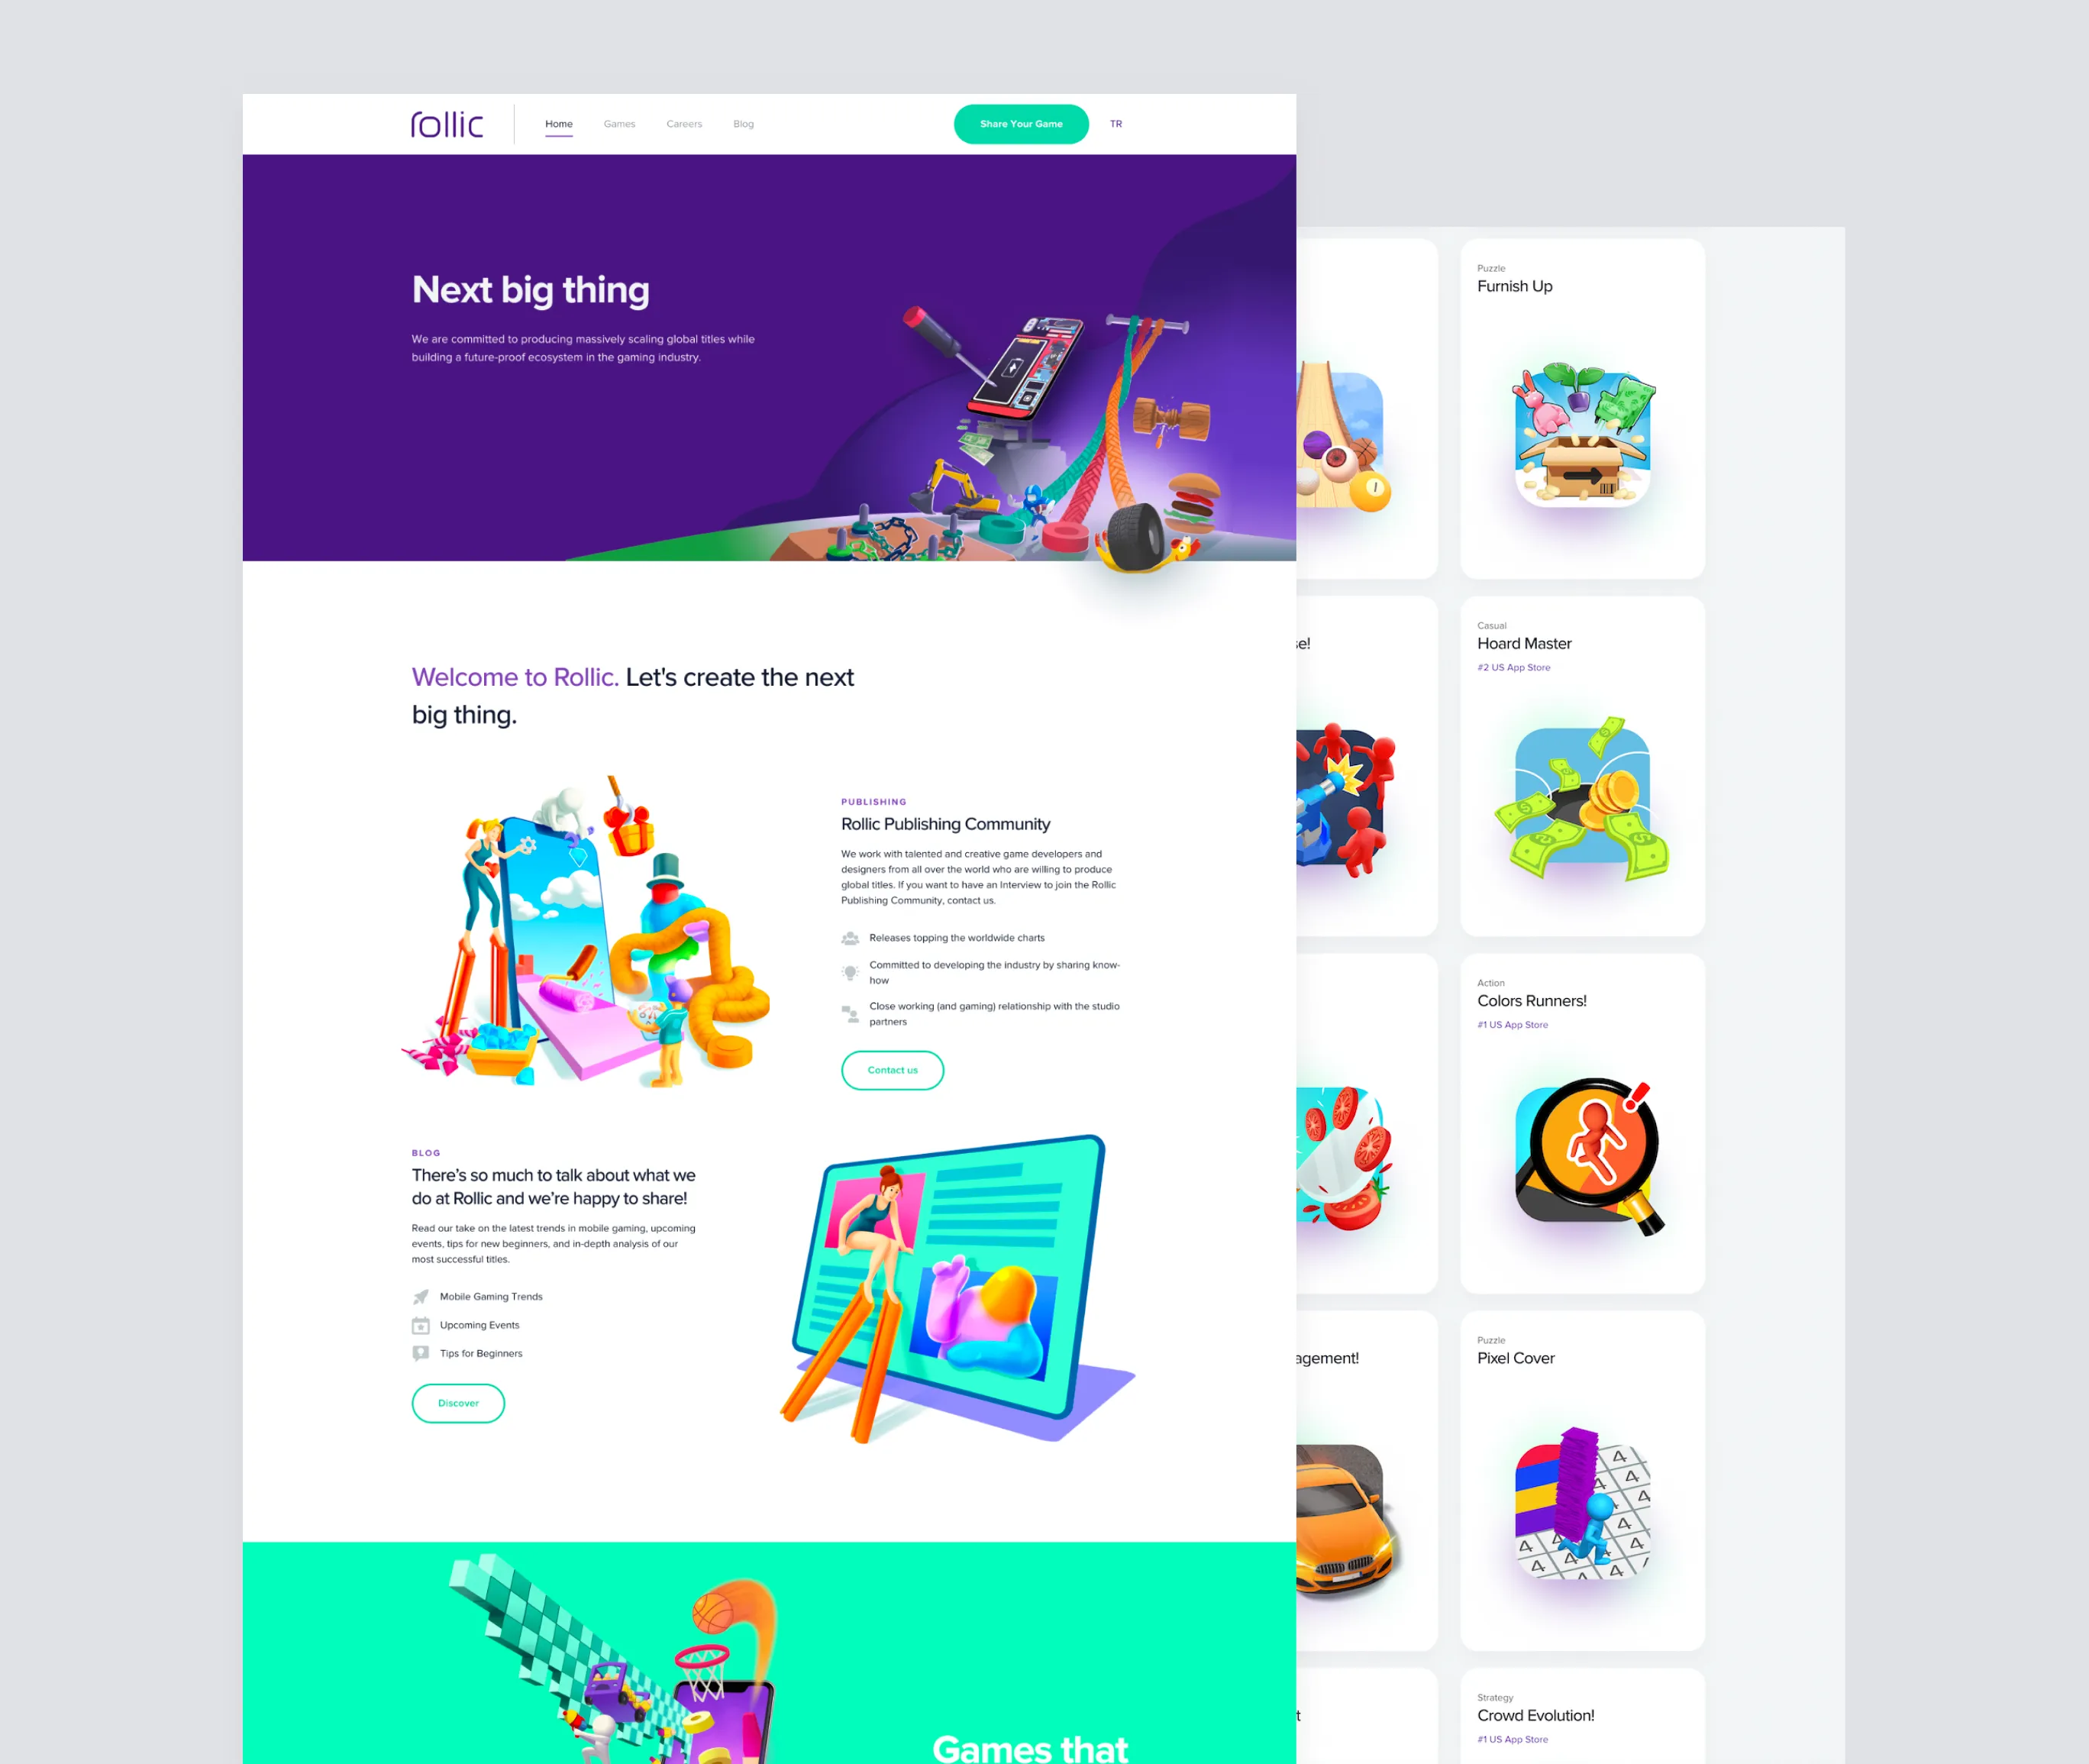 Rollic Games (Zynga)Advanced publishing platform for a gaming industry leaderTransforming the web presence of Zynga's Rollic with UI redesign and Contentful integration
 Peak (Zynga)World’s largest HR campaign for Peak, a unicorn startupHandling 500K real-time website visitors during the world's largest HR campaign by Peak
 Microsoft Xbox, TurkeyMicrosoft’s 360° nationwide campaign hub for XboxDriving 3x sales growth for Xbox through a nationwide campaign hub for Microsoft
 Kolay İKA SaaS-based HR management product used by millionsBringing a SaaS-based HR management platform to mobile for its daily 2M+ users
 Bonded (24Saatteİş), Turkey & MexicoA location-based hiring platform for blue-collar workers3M new users after launching the Bonded app built in just 100 days
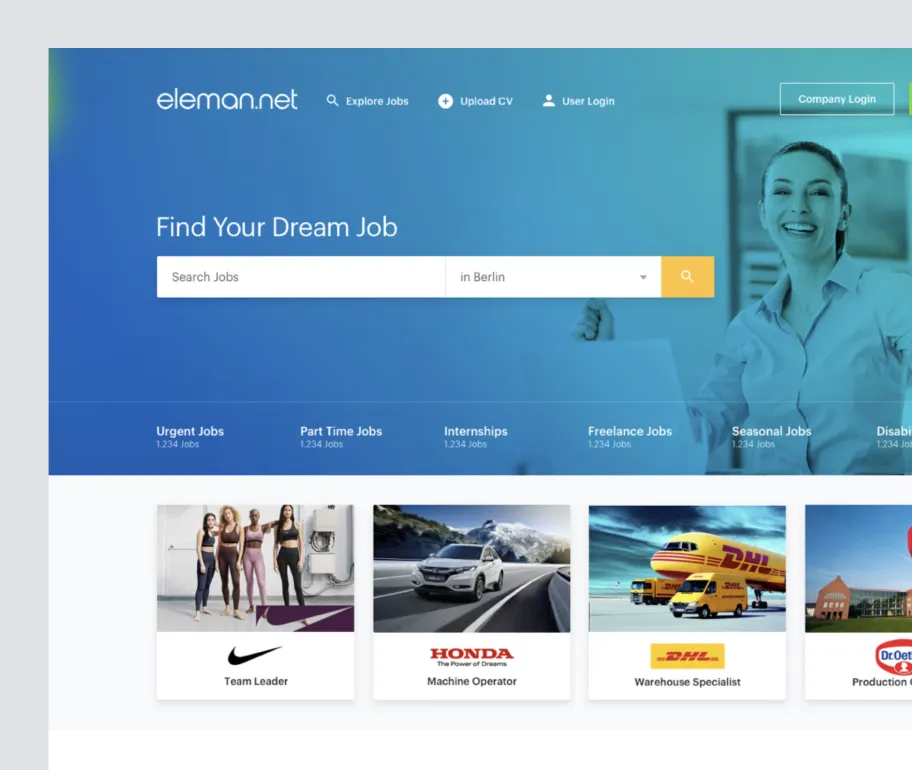 Eleman.netBlue-collar recruitment platform serving 15 millionBoosting job applications by 28% with a redesigned blue-collar recruitment platform
 YouthallNext-gen employer branding platform for the young workforceDeveloping an employer branding platform for young talent with 93% job matching accuracy
 Bookyourdata, USAUS-based sales intelligence platform with +250M contacts250M+ Contact data processed in milliseconds on US-sased sales intelligence platform
- Kolay İKA SaaS-based HR management product used by millionsBringing a SaaS-based HR management platform to mobile for its daily 2M+ users
 MoniteraComplete redesign of a global social media monitoring toolBoosting response rates by 37% with the redesign of a global social media monitoring tool
 StartupMarketEnd-to-end platform development for the entrepreneurial ecosystemCreating a startup-investor platform that enabled 120+ investments in year one alone
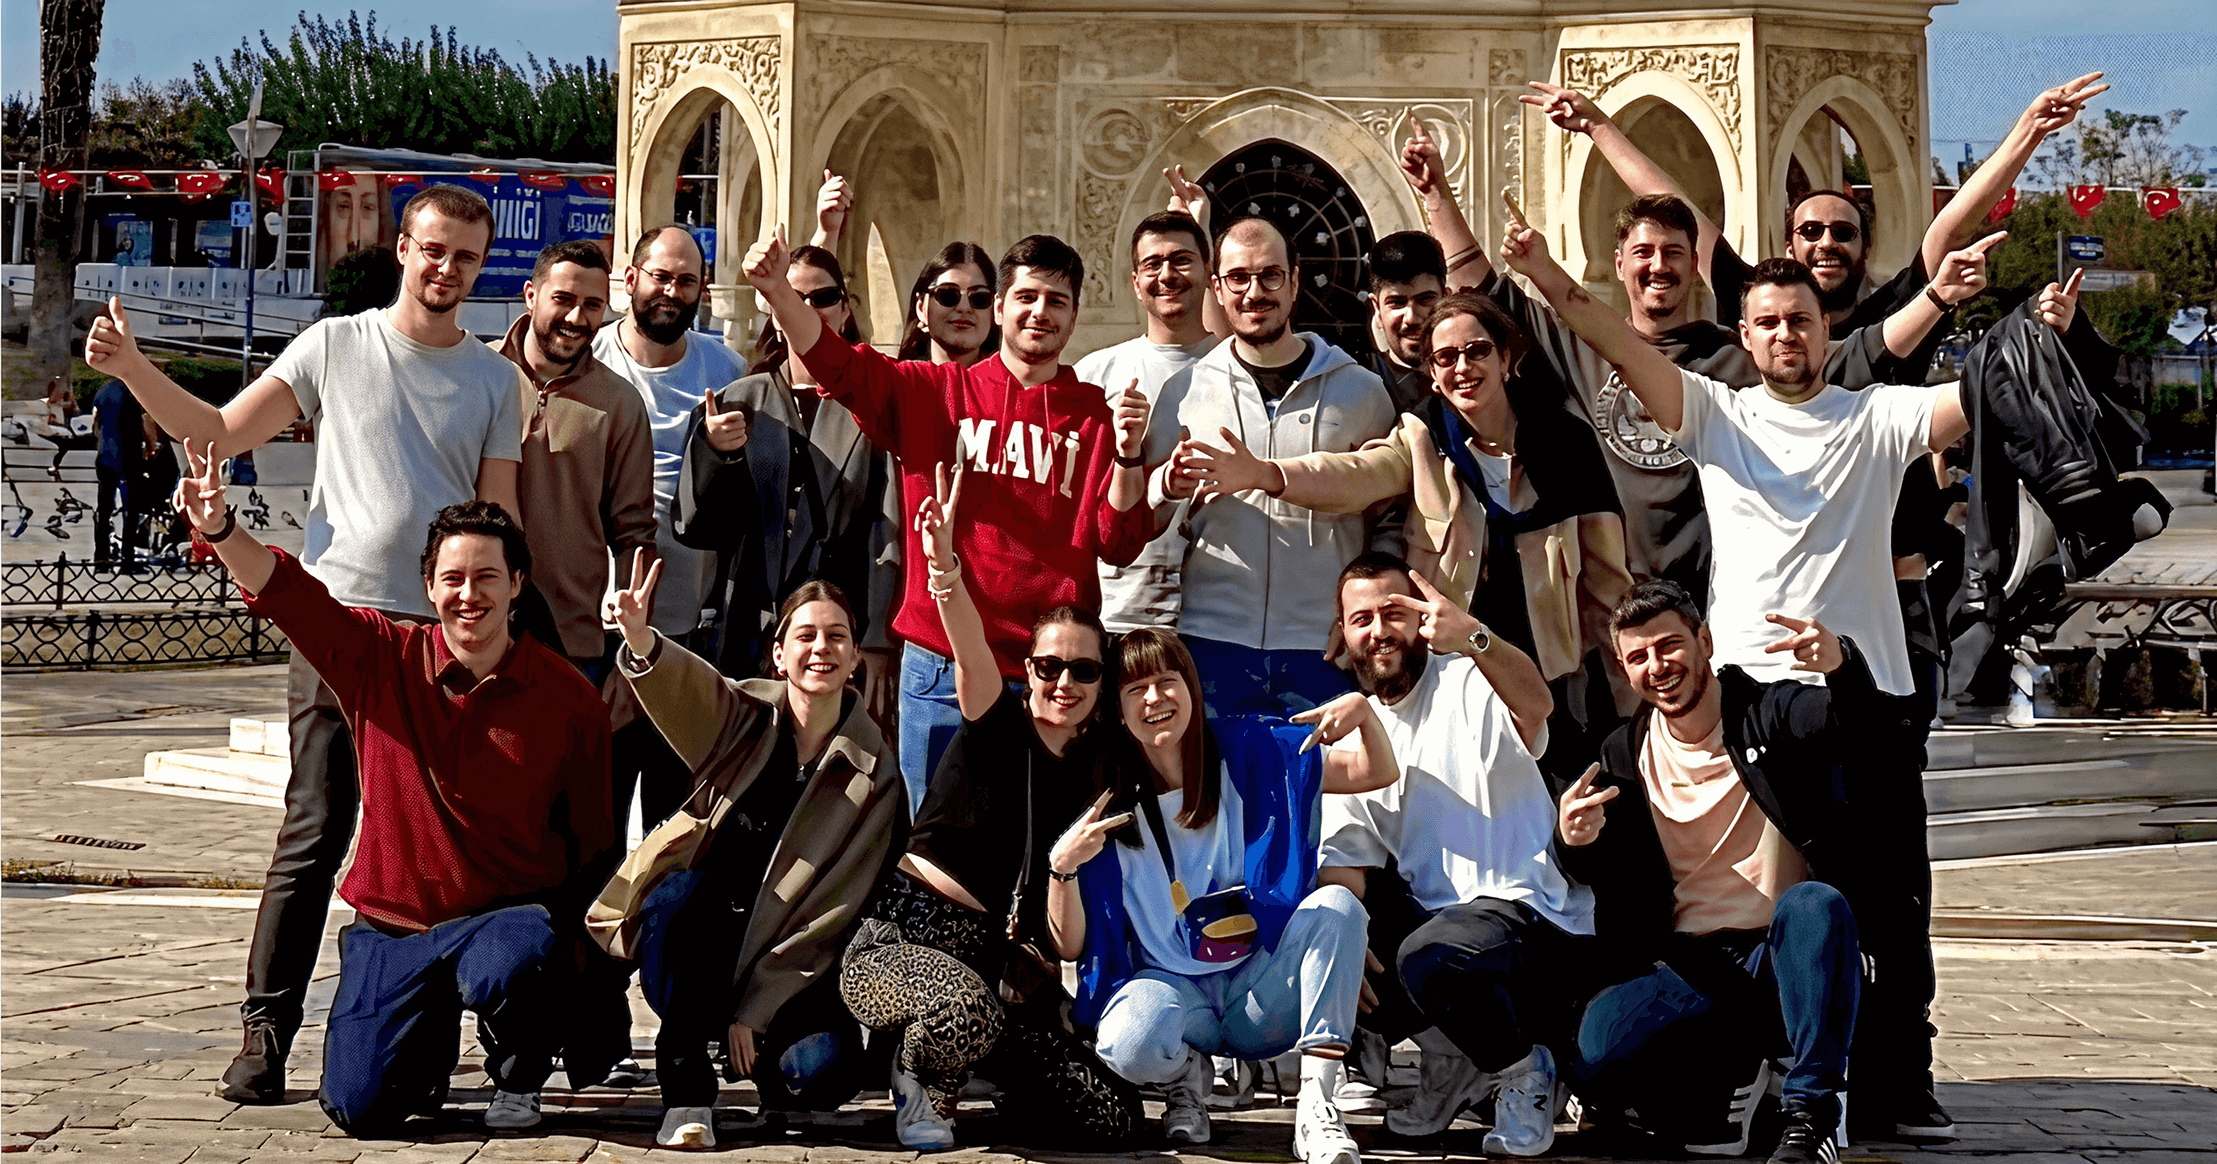
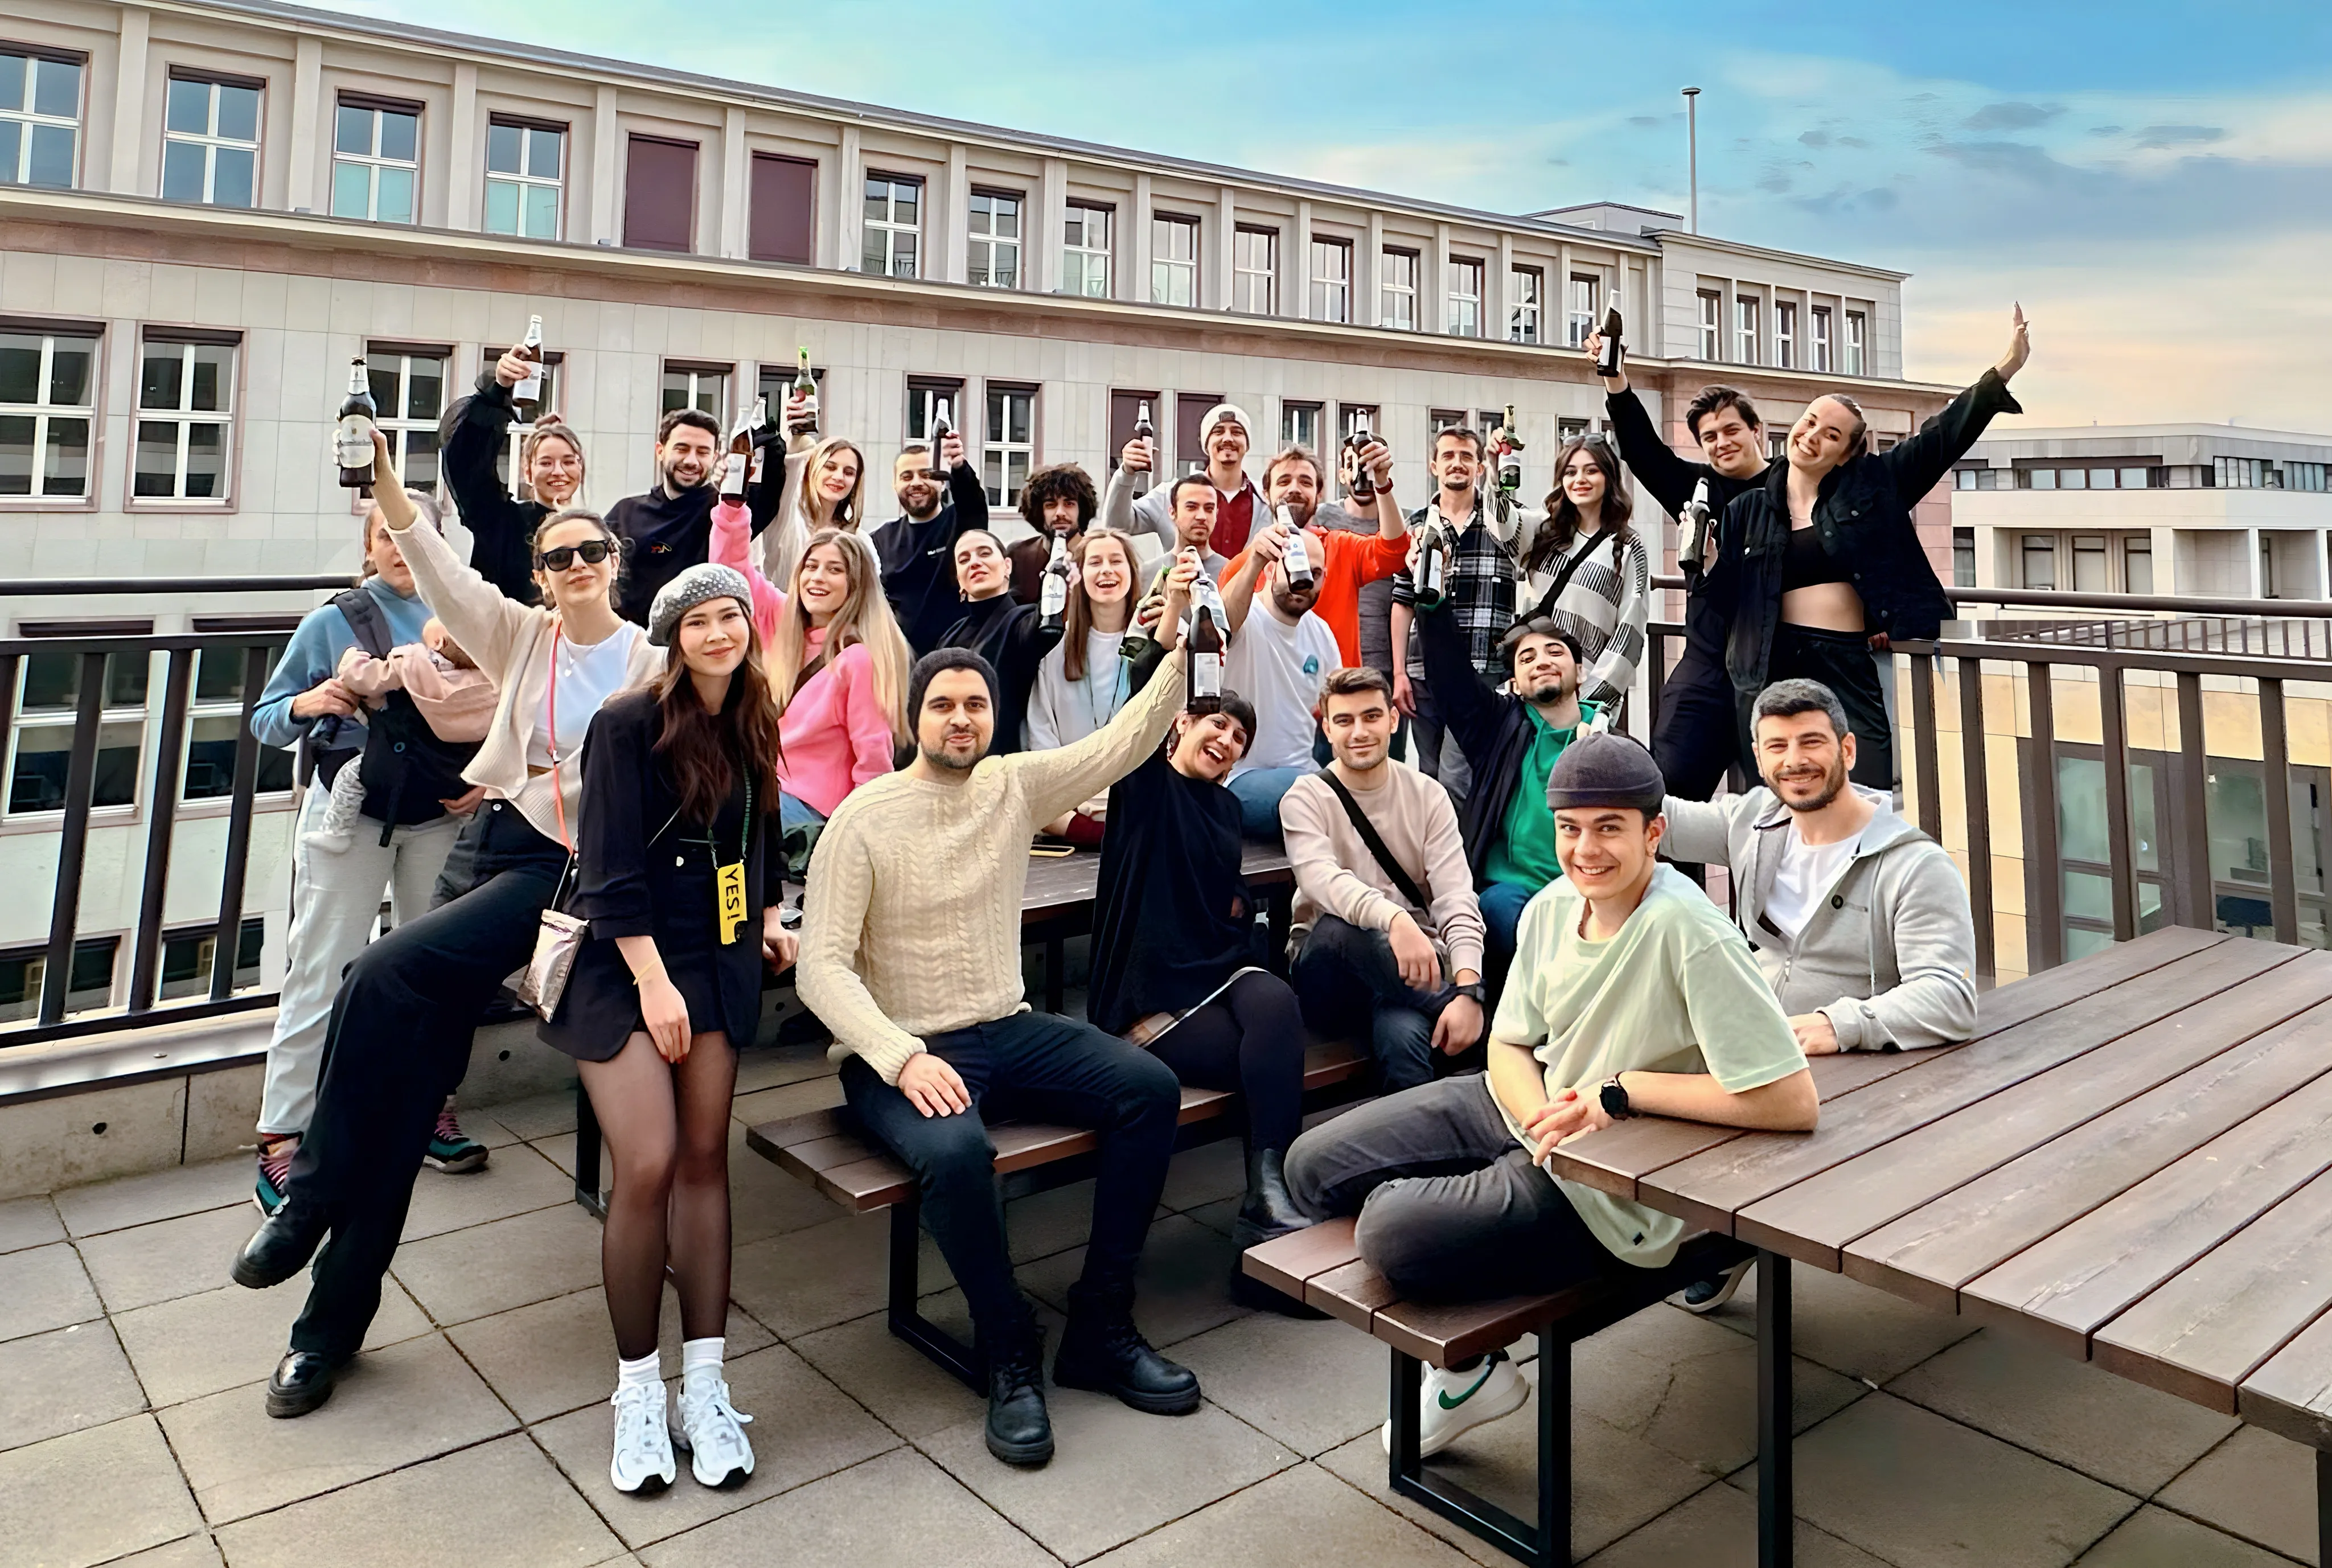
- Life at Atolye15Take a closer look at how we work, communicate, and keep our team culture strong while remote.
- Perks & BenefitsLearn about the perks and resources that support your personal and professional growth.
- Open PositionsExplore the roles we’re hiring for and find where you can bring your strengths to the team.


Ready to Team Up for Short-Term Projects?
Atolye15 Next is a platform where open development projects are posted and developers can quickly find opportunities that match their skills.
Coming Soon


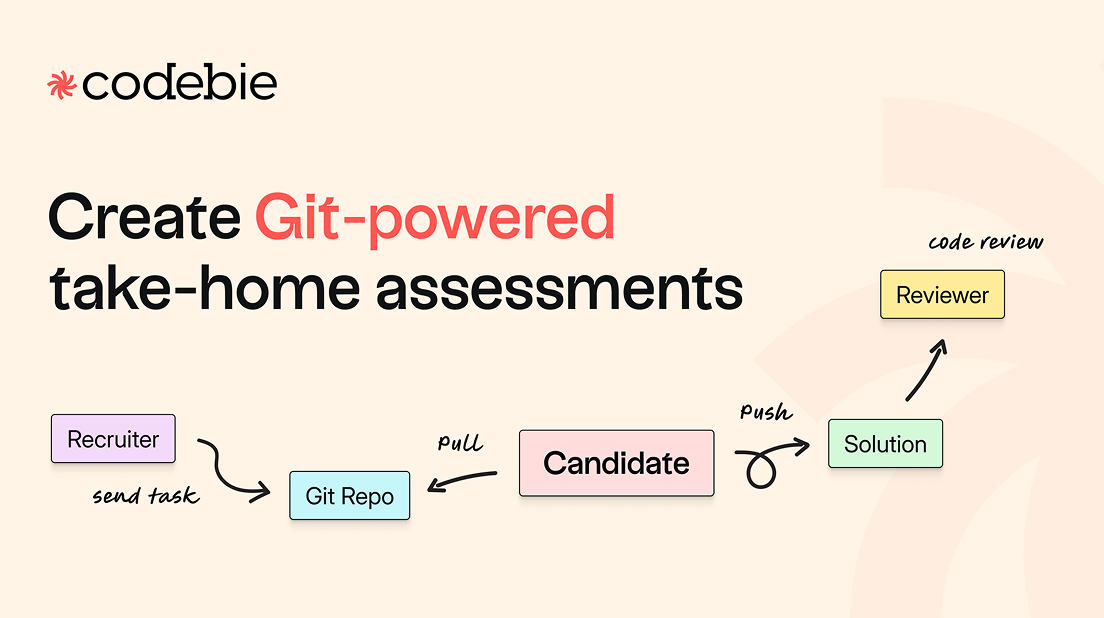
Make Developer Hiring Hassle-Free for Your Team with Codebie’s Git-Powered Assessments
Codebie helps you build custom code assessments quickly, enabling your team to evaluate candidates through line-by-line feedback.
Visit codebie.com